Methods

LEARN MORE WITH THE
Australian Cancer Atlas 2.0 Technical report
The Australian Cancer Atlas 2.0 reveals how the impact of cancer varies across Australia.
Below, you will find an overview of the methods used to create the Atlas. If you would like more detailed information about the methods, technology, data sources or visualisations, please refer to our Technical Report (e-book).
Sex
Many of the measures included in the Australian Cancer Atlas 2.0 are reported separately for Males, Females and Persons. The information about a person’s sex is sourced from the original data custodians.


Geographical Areas
The Australian Cancer Atlas 2.0 divides the country into specific areas using something called Statistical Area 2 (SA2), a classification system by the Australian Bureau of Statistics (ABS). SA2s are the smallest areas with yearly population data. The ABS says they’re meant to show communities that interact socially and economically.
These small areas can also be grouped into broader regions defined by the Australian Bureau of Statistics. Within the Australian Cancer Atlas 2.0, summaries of the spatial patterns within four broader regions are provided:
Remoteness areas
Categorises small areas across Australia into five categories of remoteness based on their relative access to services.
Socio-economic index
A measure of area-level socioeconomic disadvantage, specifically the Index of Relative Socio-economic Advantage and Disadvantage (IRSAD).
States/Territories
New South Wales (NSW), Queensland (QLD), South Australia (SA), Tasmania (TAS), Victoria (VIC), and Western Australia (WA), the Australian Capital Territory (ACT) and the Northern Territory (NT).
Capital city areas
Geographical areas designed to represent the functional extent of each of the eight state and territory capital cities.
Methods of presenting results on maps
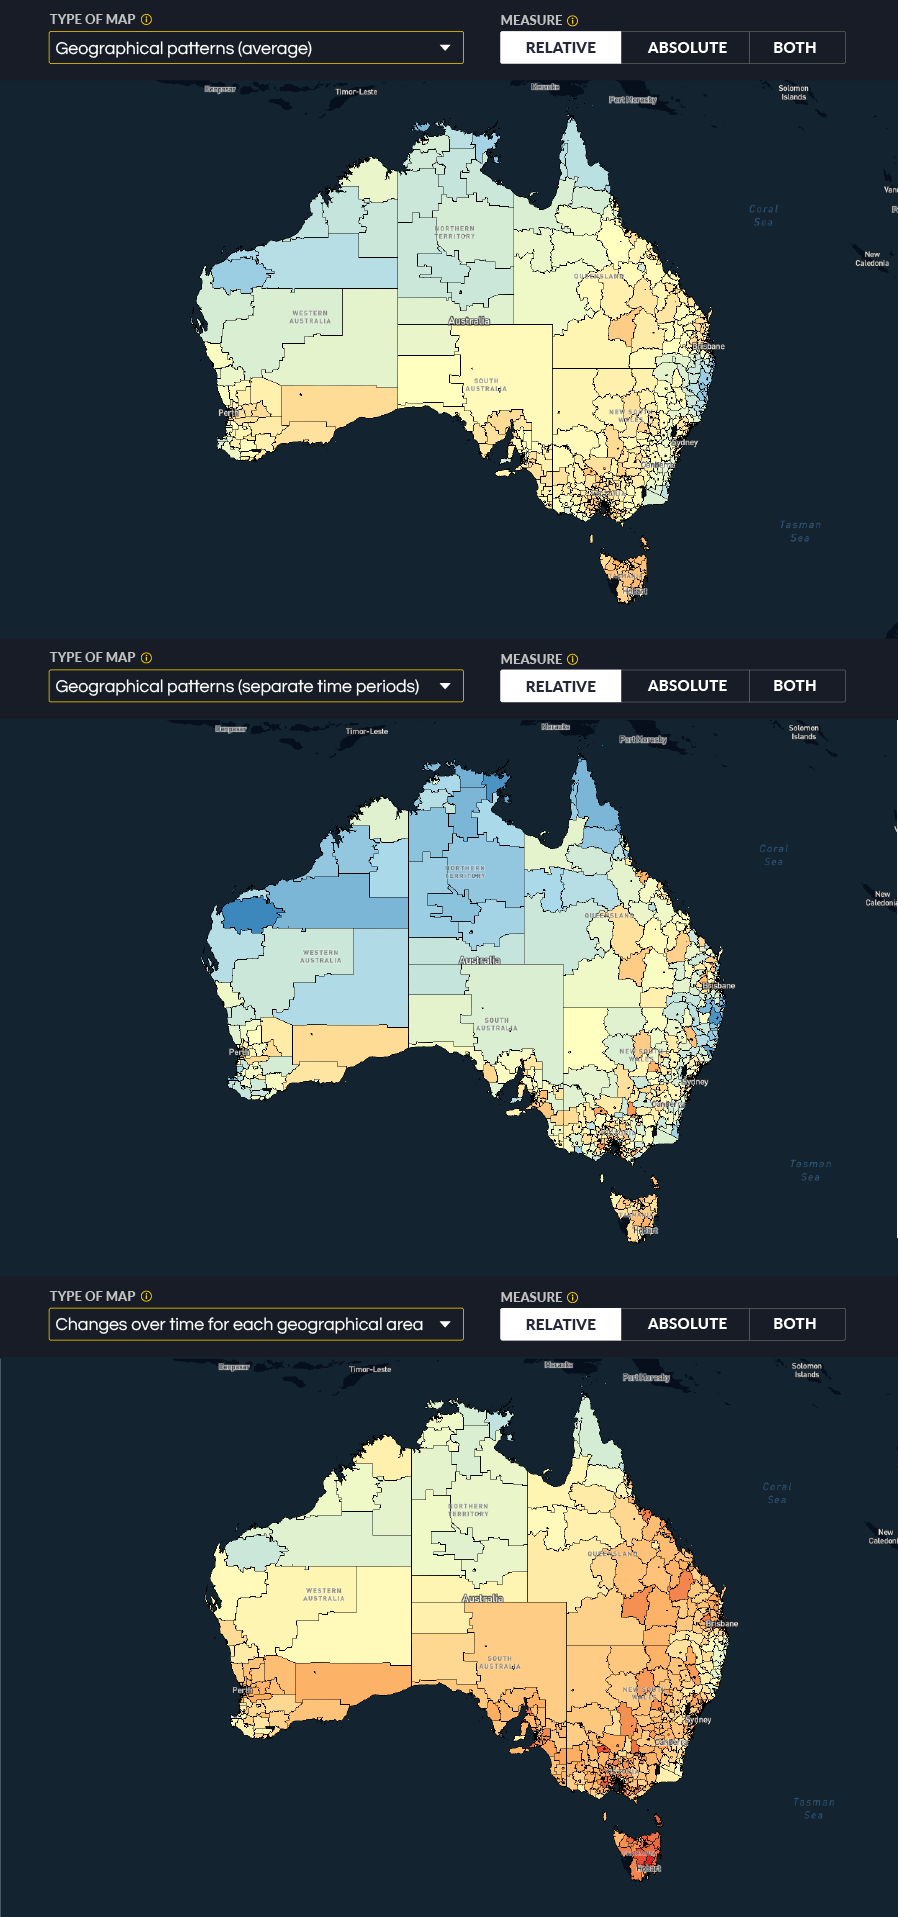
In the Australian Cancer Atlas 2.0, you’ll find three types of estimates displayed on maps, but the available types vary for each health indicator. For instance, for cancer diagnoses, you can see all three estimates, while for cancer risk factors, only Geographical Patterns (average) is accessible.
Geographical patterns (average)
Provides a snapshot of geographical patterns for the latest available time period (up to 10 years). Information is available for both relative rates (compared to the Australian average) or absolute modelled counts (such as the number of cancers diagnosed).
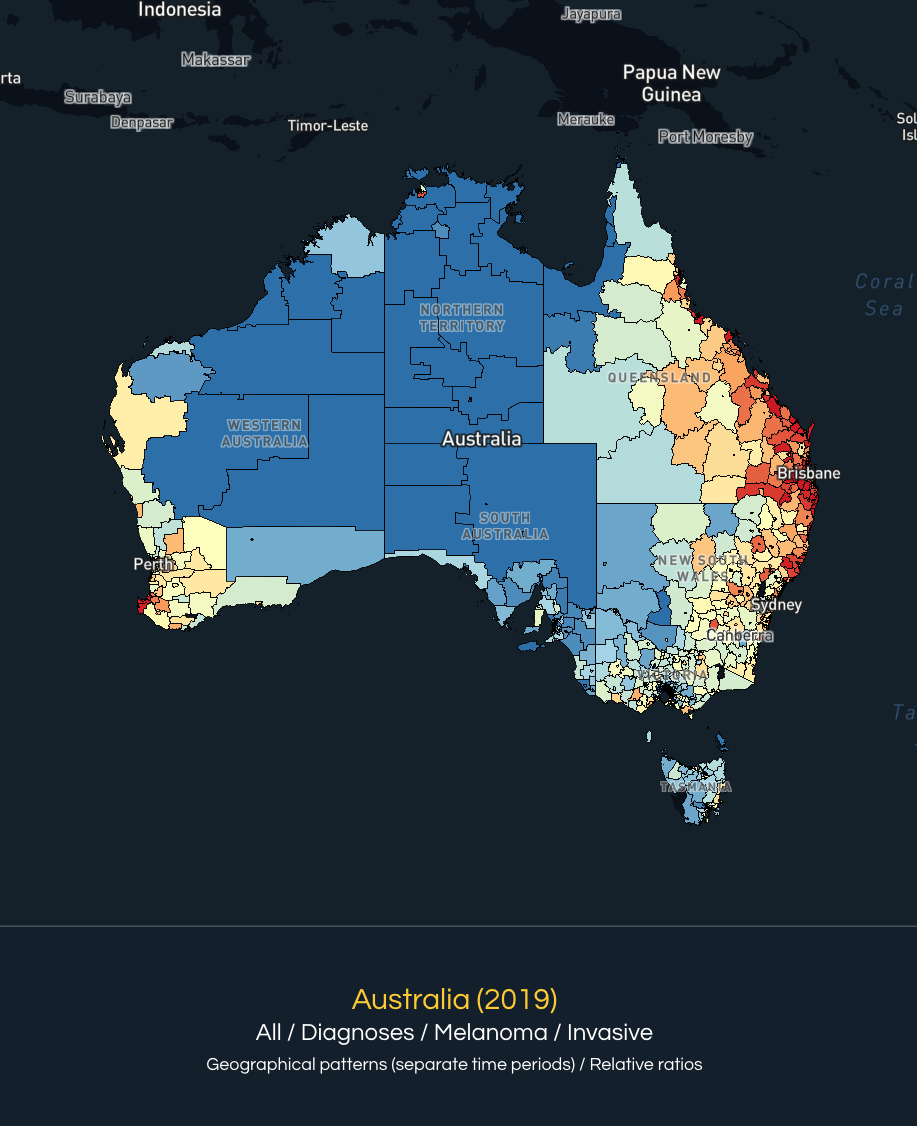
Geographical patterns for each time period
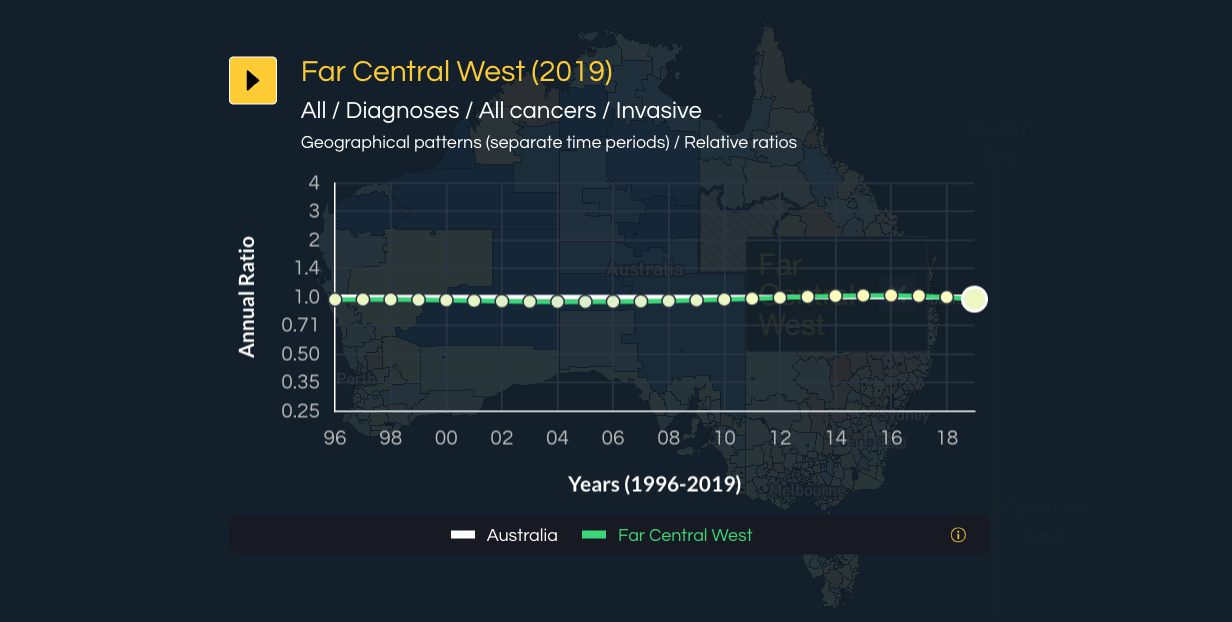
Shows how geographical patterns across Australia have changed over different time periods (typically, but not always, single years). This is available for relative estimates only, where area-specific rates for each time period are compared to the Australian average for that time period.
Changes over time for each geographical area
Shows how the rates for each geographical area have changed over a combined time period. This is also available for relative estimates only, where the area-specific rates for each time period are compared to the Australian average over the combined time period. These changes reflect the national trends over time in many cases.


Dataset sources
Cancer registry
Information about cancer diagnosis and survival across Australia comes from the Australian Cancer Database. This database is managed by the Australian Institute of Health and Welfare (AIHW). The Cancer Data and Monitoring Unit at AIHW brings together data from each of the eight state and territory cancer registries in Australia to create the Australian Cancer Database.
Hospital treatment data
Hospital admission data for any of the three treatments were extracted from the National Hospital Morbidity Database and the Australian Institute of Health and Welfare.
National Health Survey
Data from the 2017-18 National Health Survey conducted by the ABS were used to estimate the prevalence of cancer risk factors. The survey aimed to collect health information from one adult and, if possible, one child in selected households. The survey covered 76% of SA2s across Australia, with a median sample size of 8 and an interquartile range of 5 to 13 at the SA2 level.


